via forex-tsd.com
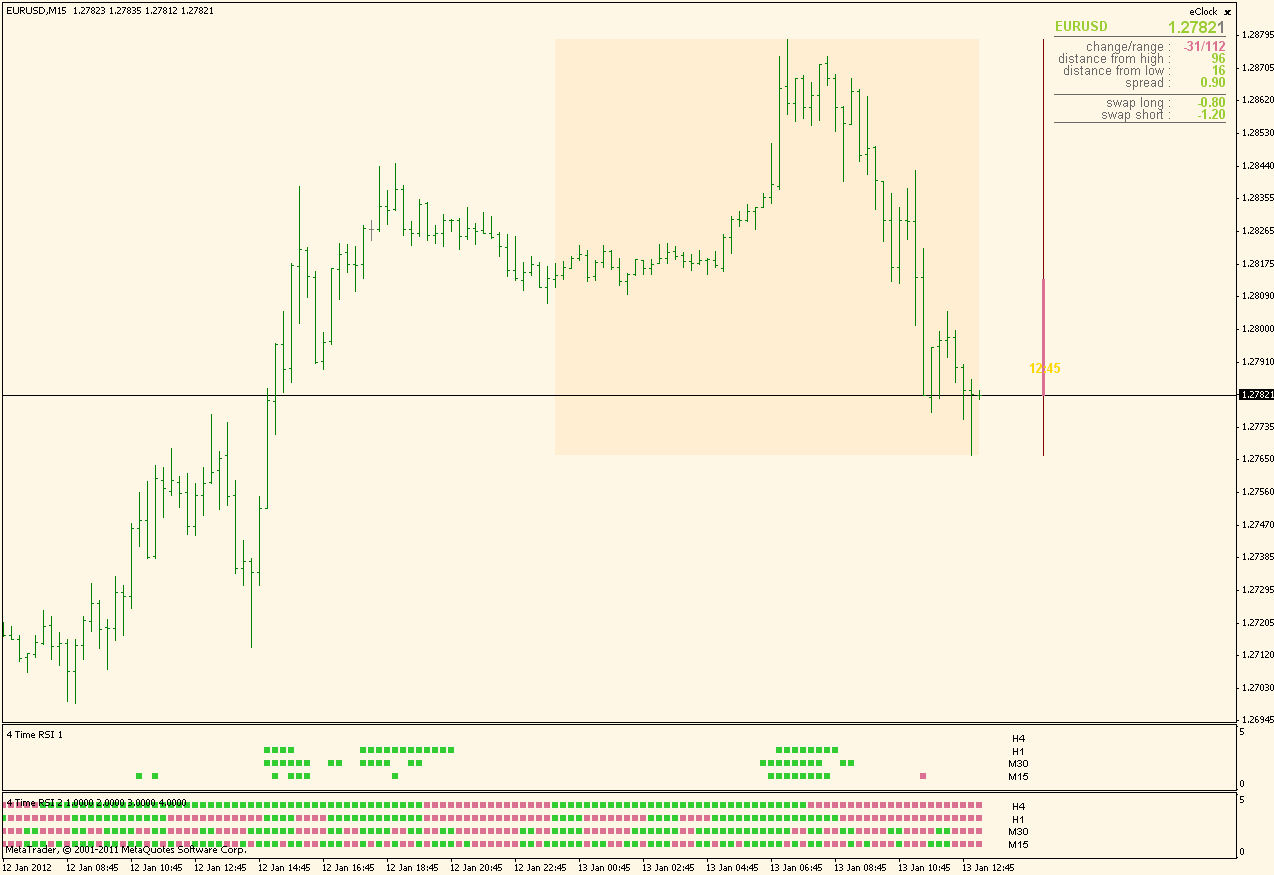
It shows states / slopes of 4 time frame rsi. Depending on the ColorsForSlope parameter it will show slope of the rsi (like lower one on the example picture) or the current relative value compared to RsiLevelUp (overbought) and RsiLevelDown (oversold) in which case a third state (in between those 2 values) is indicated by the lack of color

Комментариев нет:
Отправить комментарий