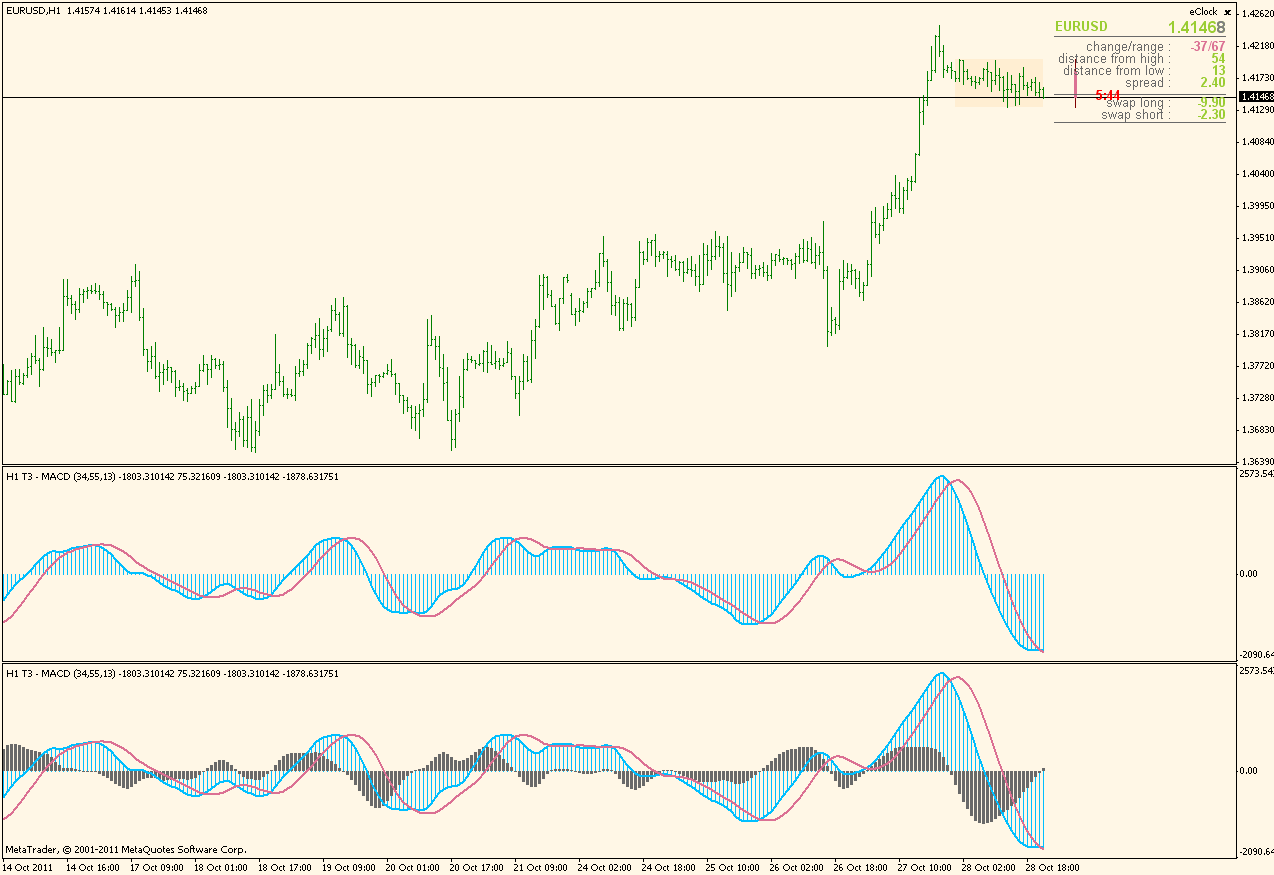
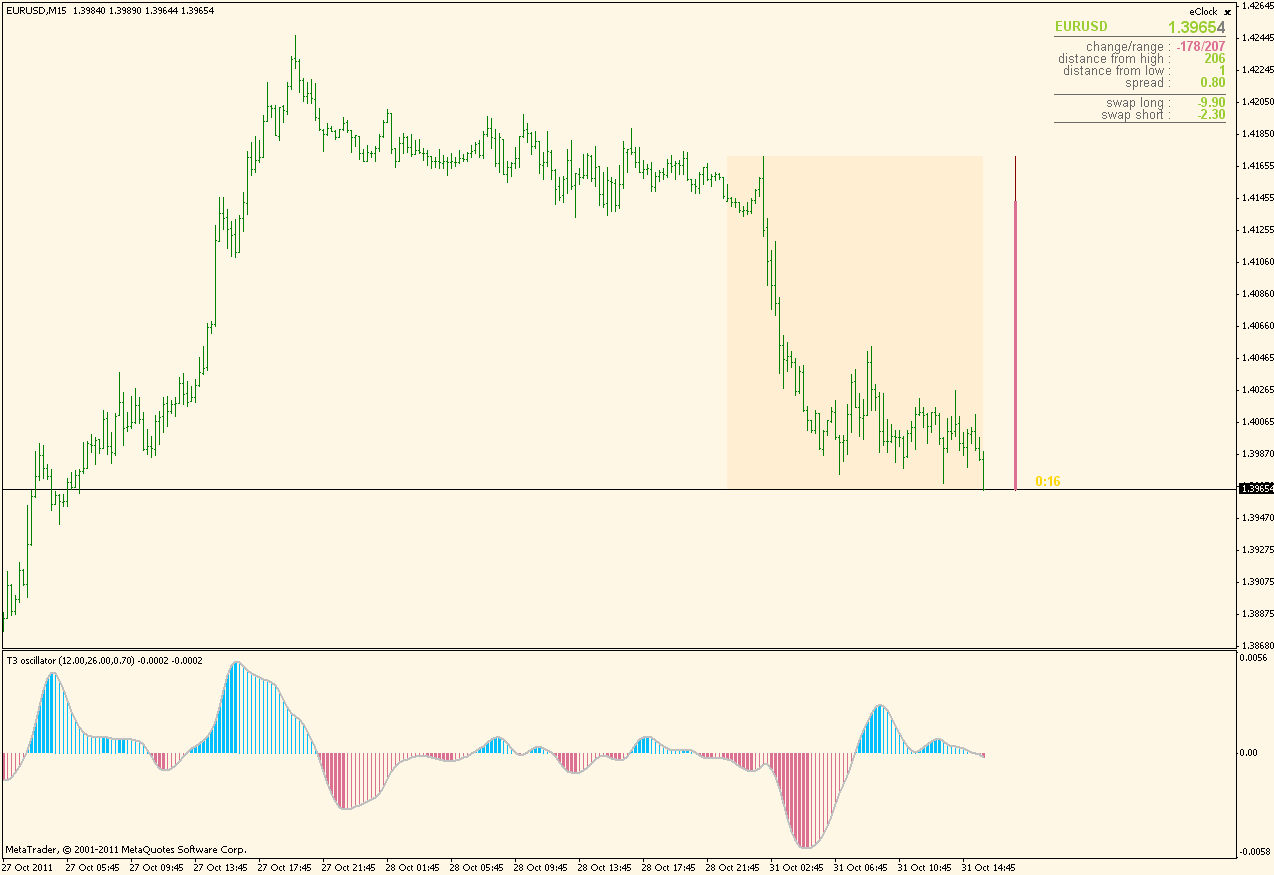
when I tried it, it turned out that with awesome oscillator calculating lengths (5,14) it is too fast.
понедельник, 31 октября 2011 г.
ergodic cci channel

This is ergodic cci channel the arrows and alerts should go off as the ergocci is leaving the top or bottom of the channel.
macd of vulumes

You will notice that it uses only non-adaptive indicators (the ones that I call a "single parameter" averages) and I would like to explain why (it will take some time though).
First I will start from metatrader 5 and some comparison : on this picture the upper macd is the macd of volumes. And ,on a first glance, everything is just fine.
четверг, 27 октября 2011 г.
воскресенье, 23 октября 2011 г.
T3 DTM

This is t3 dtm actually stlm and ftlm together they have mtf with alerts on slope change.
четверг, 20 октября 2011 г.
some light at the "CoeffoLine" indicator

Roughly it corresponds to a linear regression slope of a 5 period smoothed (high+low)/2 (median price). I say roughly because the intention of this indicator was not to replicate the CoeffoLine indicator.
This indicator shows linear regression slope of smoothed price (price smoothing used in this one is a kind of linear weighted moving average) Here is a comparison of a 10 period regression slope (lower) and ndot 10 CoeffoLine indicator values (upper). And no, this one does not "loop into itself" nor does it repaint.
среда, 19 октября 2011 г.
one more single pass computing way of standard deviation

This one dates way back to 1962 (it was proposed by B. P. Welford) and was described by Donald Knuth in his Art of Computer Programing. This one also has an option to compute standard deviation of a sample (which is by all statisticians the only correct way to calculate standard deviation - no wonder we are having funny results in TA when coders do not listen to the people that invented the math formula for some things)
Attaching also a variation of Bollinger bands indicator that depends largely on standard deviations (even though it is not a thread about Bollinger bands - this version is using by default sample deviation instead of built in deviation) in order to make it possible to compare the results of the built in and this way of standard deviation calculation. Difference is not big, but it is visible even with naked eye
понедельник, 17 октября 2011 г.
Linear Regression or LSMA?

LSMA is just a descriptive name (Least Squares MA) that describes what linear regression indicator does internally : least squares fitting. But since "least squares fitting" is a broader term from "linear least squares fit", then "linear regression value" name should be used.
